Day 25.Setting Up an EC2 Instance and CloudWatch Alarm

Cloud & SRE specializing in AWS and DevOps. I share my ongoing learning journey through practical tutorials and insights. Let's grow together.
Lab Information
The Nautilus DevOps team has been tasked with setting up an EC2 instance for their application. To ensure the application performs optimally, they also need to create a CloudWatch alarm to monitor the instance's CPU utilization. The alarm should trigger if the CPU utilization exceeds 90% for one consecutive 5-minute period. To send notifications, use the SNS topic named datacenter-sns-topic which is already created.
Launch EC2 Instance: Create an EC2 instance named datacenter-ec2 using any appropriate Ubuntu AMI.
Create CloudWatch Alarm: Create a CloudWatch alarm named datacenter-alarm with the following specifications: Statistic: Average Metric: CPU Utilization Threshold: >= 90% for 1 consecutive 5-minute period. Alarm Actions: Send a notification to datacenter-sns-topic.
Lab Solutions
🔹 STEP 1: Launch the EC2 Instance 1️⃣ Open EC2
AWS Console → EC2 → Launch instance
2️⃣ Configure instance
Name: datacenter-ec2
AMI: Ubuntu Server (20.04 LTS or 22.04 LTS)
Instance type: t2.micro (or any allowed type)
Key pair: Select or create one (lab choice)
Network:
Default VPC
Default subnet
Security group:
Allow SSH (port 22)
3️⃣ Launch
Click Launch instance
Wait until:
State: Running
Status checks: 2/2 passed
🔹 STEP 2: Create the CloudWatch Alarm 1️⃣ Open CloudWatch
AWS Console → CloudWatch
Left menu → Alarms
Click Create alarm
2️⃣ Select the Metric
Click Select metric
Navigate:
EC2 → Per-Instance Metrics → CPUUtilization
Select the metric for datacenter-ec2
Click Select metric
3️⃣ Configure Alarm Conditions
Set the following exactly:
Setting Value Statistic Average Period 5 minutes Threshold type Static Condition Greater than or equal to Threshold value 90 Datapoints to alarm 1 out of 1 4️⃣ Configure Alarm Actions
Alarm state trigger: In alarm
Send notification to:
Select Existing SNS topic
Choose datacenter-sns-topic
5️⃣ Name the Alarm
Alarm name: datacenter-alarm
Description (optional):
Alarm when CPU exceeds 90% for 5 minutes
Click Create alarm
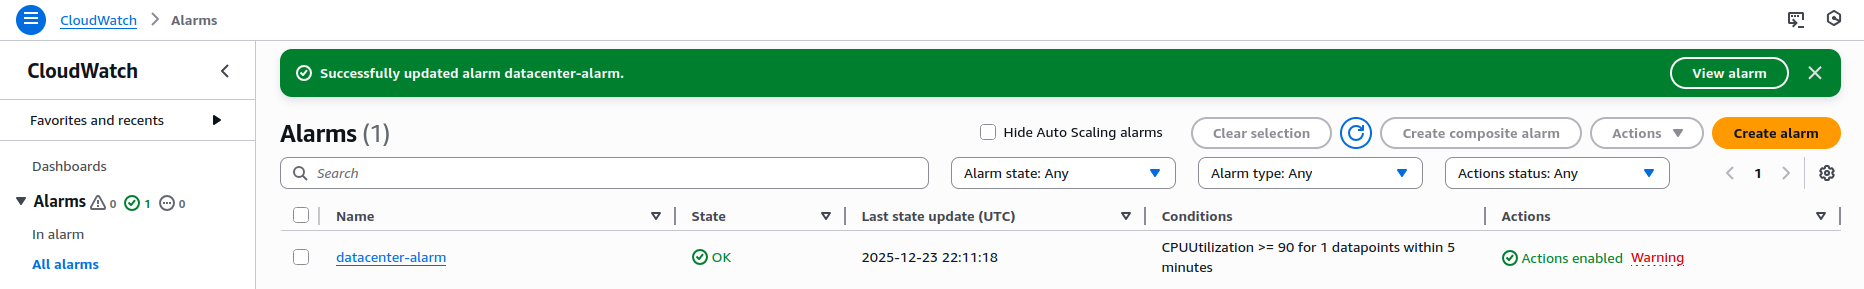
🔹 STEP 3: Verify Configuration ✔ CloudWatch Alarm
State initially: OK (normal)
Metric: CPUUtilization
Threshold: ≥ 90%
Period: 5 minutes
✔ SNS Action
Alarm action shows datacenter-sns-topic